Introduction
The main goal of this article is to analize different OrientDB Graph Database performances, when deployed on different ZFS filesystem setup.The test is general enough to be reffered to every Operating System that support ZFS: Solaris, IllumOS based OS, FreeBSD, Mac OS X, and so on.
Almost all the DTrace script and one-liners used for the analysis come from, or are inspired by, DTrace Tool Kit (DTTK), by Brendan Gregg.
NOTE 2014/06/30:
For an (almost) real use case, read here.
Environment
- Server IBM xSeries 346
- 12286 MB RAM
- 2 CPU x86 Intel Xeon (GenuineIntel F4A Family 15 model 4 step 10 clock 3000MHz)
- 2 HDD 279.40 GB (IBM-ESXS-MAW3300NC FN-C206)
- Solaris 11.1
- OrientDB 1.6.4 Community Edition
- Oracle JDK 1.7.51 - 64 bit
Method
I compared the database import time from a json backup file, having different ZFS configurations.I used a backup from a prototype modelled by the company I’m working for. Here some details:
- 2 indexes
- 129 clusters
- 130 classes
- 21304 Total links
- 21305 records
I know, this is a little bit trivial, but at this time this is all I can do whitout affecting my daily job.
If someone from Orient Technologies wants give me other material - let’s say a bigger database and a correspondending set of queries, I’ll be happy to repeat my tests.
Before every test, I executed these commands from the global-zone:
- shutdown orientdbZone
- destroy zfs partitions related to orientdbZone
- create zfs partitions related to orientdbZone, with new parameters
- boot orientdbZone
- login into the orientdbZone
- start OrientDB server
- start OrientDB console
- create new database
After every test, I executed these commands from the orientdbZone:
- drop database
- shutdown OrientDB Server
- logout from the orientdbZone
Preliminary investigations
First of all I tried to understand what OrientDB server does during its import database process, so I collected some useful informatons using this simple DTrace one-liner:
root@globalZone:~# dtrace -n 'fsinfo:::write { @[args[0]->fi_mount] = quantize(arg1); }'
dtrace: description 'fsinfo:::write ' matched 1 probe
/zones/orientdbZone/root/opt/orientdb-community-1.6.4/databases
value ------------- Distribution ------------- count
0 | 0
1 |@@@@@@@@@@@@@@@@@@@@@@@@@@ 8811
2 | 0
4 | 0
8 |@ 407
16 | 77
32 |@ 182
64 | 6
128 | 0
256 | 13
512 | 12
1024 | 26
2048 | 47
4096 | 35
8192 | 0
16384 | 0
32768 | 0
65536 |@@@@@@@@@@@@ 4125
131072 | 0
Unluckily the write byte sizes aren’t well distributed, and they are mainly of two types:
- >= 1 byte size (8811 times)
- 65536 bytes size (4125 times)
I wrote a simple writeSizeStats.d DTrace program
#!/usr/sbin/dtrace -Zs
syscall::*write*:entry
{
self->fd = arg0;
}
syscall::*write*:return
/fds[self->fd].fi_mount == $$1/
{
@media[probefunc] = avg(arg1);
@devStd[probefunc] = stddev(arg1);
}
dtrace:::END
{
printa("\n avg %s --> %@d", @media);
printa("\n stddev %s --> %@d",@devStd);
root@globalZone:~# ./writeSizeStats.d /zones/orientdbZone/root/opt/orientdb-community-1.6.4/databases
avg write --> 11335
avg pwrite --> 48896
stddev write --> 24784
stddev pwrite --> 28396
The deviation standard values are too high compared to the averages, so I expect that only setting up the ZFS recordsize equal or less than 32k I can observe a different behavior, but the only way to reach the right compromise is to experiment.
NOTE 2014/06/30:
For an (almost) real use case, read here.
Test #1 - OrientDB datafiles in a dedicated disk with ZFS partition
Preparation
I created a new zpool using the second HDD, then I created many times a new zfs partition in it, each time with a different recordsize parameter, assigned to the orientdbZone:
root@globalZone:~# zpool list
NAME SIZE ALLOC FREE CAP DEDUP HEALTH ALTROOT
rpool 278G 19.1G 259G 6% 1.17x ONLINE -
root@globalZone:~# zpool status
pool: rpool
state: ONLINE
scan: none requested
config:
NAME STATE READ WRITE CKSUM
rpool ONLINE 0 0 0
c7t0d0 ONLINE 0 0 0
errors: No known data errors
root@globalZone:~# zpool create databases c7t1d0
root@globalZone:~# zpool list
NAME SIZE ALLOC FREE CAP DEDUP HEALTH ALTROOT
databases 3.72G 158K 3.72G 0% 1.00x ONLINE -
rpool 278G 19.1G 259G 6% 1.17x ONLINE -
root@globalZone:~# zfs create -o mountpoint=legacy databases/datafiles
root@globalZone:~# zonecfg -z orientdbZone
zonecfg:orientdbZone> add fs
zonecfg:orientdbZone:fs> set type=zfs
zonecfg:orientdbZone:fs> set special=databases/datafiles
zonecfg:orientdbZone:fs> set dir=/opt/orientdb-community-1.6.4/databases
zonecfg:orientdbZone:fs> end
zonecfg:orientdbZone> verify
zonecfg:orientdbZone> commit
zonecfg:orientdbZone> exit
root@globalZone:~# zoneadm -z orientdbZone boot
root@globalZone:~# zlogin orientdbZone
root@orientdbZone:~# /opt/orientdb-community-1.6.4/bin/server.sh &
root@orientdbZone:~# /opt/orientdb-community-1.6.4/bin/console.sh
Test
orientdb> create database remote:localhost/kubique root root plocal graph
orientdb> import database /opt/kubique.json -preserveClusterIDs=false
The following table shows the database import time, expressed in milliseconds, for each ZFS recordsize:
recordsize
|
128k
|
64k
|
32k
|
16k
|
8k
|
4k
|
2k
|
1k
|
512b
|
import time
|
183909
|
184766
|
163104
|
162458
|
164102
|
165402
|
168672
|
170987
|
180703
|

As expected, only with a ZFS recordsize < 64k we can have a valuable process time reduction.
Interesting to note that with a too much little ZFS recordsize, the averall performance gets worse.
I thought that this is due to the ZFS copy-on-write integrity strategy (COW), that implies a checksum for every target block, verified when the block is read. So I executed another run having the minimum recordsize allowed and disabled the checksum ZFS feature:
root@globalZone:~# zfs destroy databases/datafiles
root@globalZone:~# zfs create -o mountpoint=legacy -o checksum=off -o recordsize=512 databases/datafiles
But the import database process takes the same time than before:
orientdb> import database /opt/kubique.json -preserveClusterIDs=false
[...]
Database import completed in 180257 ms
orientdb>

Then, we can deduce that the overhead is mainly due to the filesystem bookkeeping.
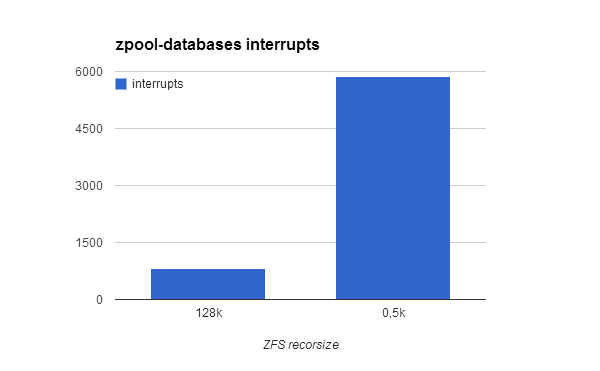
Using another DTrace one-liner, I verified my suspect counting the number of interrupts during the import database process:
(recordsize=128k - default)
root@globalZone:~# dtrace -n 'fbt::do_interrupt:entry { @[execname] = count(); }'
dtrace: description 'fbt::do_interrupt:entry ' matched 1 probe
[...]
zpool-databases 820
java 59766
(recordsize=512 bytes)
root@globalZone:~# dtrace -n 'fbt::do_interrupt:entry { @[execname] = count(); }'
dtrace: description 'fbt::do_interrupt:entry ' matched 1 probe
[...]
zpool-databases 5873
java 67579
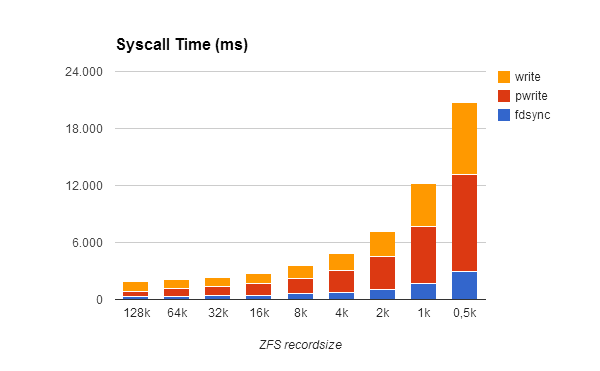
Helped by procsystime from DTTK, I was able to measure how the syscall times grow up when we have a small recordsize, and a greater blocks number:
Test #2 - OrientDB data files in a dedicated disk with ZFS compression feature enabled
Preparation
I destroyed and re-created the databases/datafiles ZFS partition, having enabled the compression feature:
root@globalZone:~# zoneadm -z orientdbZone shutdown
root@globalZone:~# zfs destroy databases/datafiles
root@globalZone:~# zfs create -o mountpoint=legacy -o compression=on databases/datafiles
root@globalZone:~# zoneadm -z orientdbZone boot
root@globalZone:~# zlogin orientdbZone
root@orientdbZone:~# /opt/orientdb-community-1.6.4/bin/server.sh &
root@orientdbZone:~# /opt/orientdb-community-1.6.4/bin/console.sh
Test
orientdb> create database remote:localhost/kubique root root plocal graph
orientdb> import database /opt/kubique.json -preserveClusterIDs=false
The following table shows the database import time, expressed in milliseconds, for each ZFS recordsize:
recordsize
|
128k
|
64k
|
32k
|
16k
|
8k
|
4k
|
2k
|
1k
|
512b
|
import time
|
180865
|
184543
|
161304
|
162872
|
164029
|
167760
|
175149
|
188992
|
215314
|
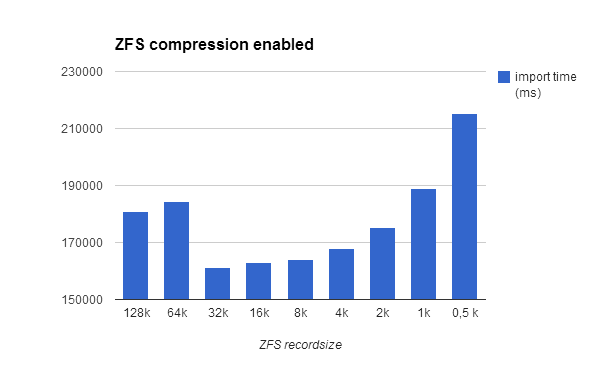
I think this is due to the fact that the import database process involves several read (and decompression) syscalls, and several COWs, then many decompress-copy-compress-checksum tasks.

However, we must have a look on the major effect of an integrated compression function: the space saved on disk
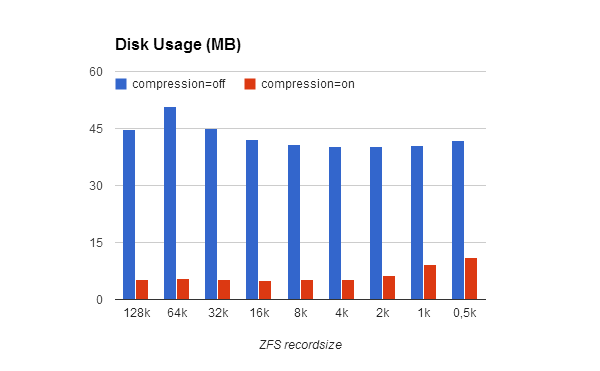
So we have a great advantage in terms of disk usage, at a neglegible CPU time cost.
Interesting to note that with a too much little ZFS recordsize, we have the worst performance again, maybe because ZFS have to store metadata for each block, and with a much greater number of blocks we are wasting storage resources.
But OrientDB has its own compression strategy, using Google Snappy library, so what about if we disable this funcion combined with the ZFS compression feature enabled? Let’s check
Change OrientDB main configuration file
root@orientdbZone:~# vim /opt/orientdb-community-1.6.4/config/orientdb-server-config.xml
<properties>
[...]
<entry value="nothing" name="storage.compressionMethod"/>
[...]
</properties>
import time table (ms)
recordsize
|
128k
|
64k
|
32k
|
16k
|
8k
|
4k
|
2k
|
1k
|
512b
|
snappy on
|
180865
|
184543
|
161304
|
162872
|
164029
|
167760
|
175149
|
188992
|
215314
|
snappy off
|
181089
|
180243
|
162731
|
161978
|
163660
|
167663
|
178134
|
188672
|
216892
|
disk usage table (KB)
recordsize
|
128k
|
64k
|
32k
|
16k
|
8k
|
4k
|
2k
|
1k
|
512b
|
snappy on
|
5312
|
5625
|
5490
|
5231
|
5264
|
5365
|
6392
|
9320
|
11202
|
snappy off
|
5320
|
5643
|
5530
|
5300
|
5399
|
5688
|
6502
|
9723
|
12775
|
There aren’t meaningful differences, nor in process time neither in disk usage.
Import database is an I/O bound process, whereas the compression is CPU bound, and perhaps my database has too few records to bring out any difference.
Test #3 - OrientDB data files in a dedicated disk and WAL in another disk
Using plocal storage engine, OrientDB ensures data integrity by leveraging on a Write Ahead Log system.We can specify a different filesystem for the WAL temporary files, avoiding read/write concurrency.
Further, we can observe both filesystems behavior, and specify a different tuning for each.
Preparation
I repeated some tests in order to verify any differences in byte sizes operations between the two filesystems
Create a path for WAL
root@orientdbZone:~# mkdir /opt/orientdb-community-1.6.4/wal
Change OrientDB main configuration file
root@orientdbZone:~# vim /opt/orientdb-community-1.6.4/config/orientdb-server-config.xml
<properties>
[...]
<entry value="/opt/orientdb-community-1.6.4/wal" name="storage.wal.path"/>
[...]
</properties>
Create a new ZFS filesystem in an other storage pool, dedicated to the Write Ahead Log
root@globalZone:~# zoneadm -z orientdbZone shutdown
root@globalZone:~# zfs destroy databases/datafiles
root@globalZone:~# zfs create -o mountpoint=legacy databases/datafiles
root@globalZone:~# zfs create -o mountpoint=legacy rpool/wal
root@globalZone:~# zonecfg orientdZone
root@globalZone:~# zonecfg -z orientdbZone
zonecfg:orientdbZone> add fs
zonecfg:orientdbZone:fs> set type=zfs
zonecfg:orientdbZone:fs> set special=rpool/wal
zonecfg:orientdbZone:fs> set dir=/opt/orientdb-community-1.6.4/wal
zonecfg:orientdbZone:fs> end
zonecfg:orientdbZone> verify
zonecfg:orientdbZone> commit
zonecfg:orientdbZone> exit
root@globalZone:~# zoneadm -z orientdbZone boot
I Ran a couple of times the import database process, and I collected byte sizes informations using this rw_bytes.d DTrace program:
#! /usr/sbin/dtrace -Zs
syscall::*write*:entry
{
self->fd = arg0
}
syscall::*write*:return
/fds[self->fd].fi_mount == $$1/
{
@syscalls[fds[self->fd].fi_fs, probefunc]= count();
@bytes[fds[self->fd].fi_fs, probefunc, fds[self->fd].fi_mount] = sum(arg1);
@distrib[fds[self->fd].fi_fs, probefunc, fds[self->fd].fi_mount] = quantize(arg1);
}
syscall::*write*:return
/fds[self->fd].fi_mount == $$1/
{
self->fd = 0;
}
dtrace:::END
{
printa("\n %s %s %s %@d", @distrib);
printa("\n %s %s %s --> %@d bytes", @bytes);
printa("\n numberOf %s %s --> %@d", @syscalls);
}
root@globalZone:~# ./rw_bytes.d /zones/orientdbZone/root/opt/orientdb-community-1.6.4/wal
dtrace: script './rw_bytes.d' matched 13 probes
CPU ID FUNCTION:NAME
0 2 :END
zfs write /zones/orientdbZone/root/opt/orientdb-community-1.6.4/wal
value ------------- Distribution ------------- count
0 | 0
1 |@@@@@@@@@@@@@@@@@@@@@@@@@@@@@@ 5260
2 | 0
4 | 0
8 | 0
16 | 0
32 | 0
64 | 0
128 | 0
256 | 0
512 | 0
1024 | 0
2048 | 0
4096 | 0
8192 | 0
16384 | 0
32768 | 0
65536 |@@@@@@@@@@ 1819
131072 | 0
zfs write /zones/orientdbZone/root/opt/orientdb-community-1.6.4/wal --> 119215244 bytes
numberOf zfs write --> 7079
root@globalZone:~# ./rw_bytes.d /zones/orientdbZone/root/opt/orientdb-community-1.6.4/databases
dtrace: script './rw_bytes.d' matched 13 probes
CPU ID FUNCTION:NAME
1 2 :END
zfs write /zones/orientdbZone/root/opt/orientdb-community-1.6.4/databases
value ------------- Distribution ------------- count
0 | 0
1 |@@@@@@@@@@@@@@@@@@@@@@@@@@@@@@@@@@@@@ 3276
2 | 0
4 | 0
8 | 8
16 |@ 77
32 |@@ 182
64 | 6
128 | 0
zfs pwrite /zones/orientdbZone/root/opt/orientdb-community-1.6.4/databases
value ------------- Distribution ------------- count
0 | 0
1 |@@@ 275
2 | 0
4 | 0
8 |@@@@@ 399
16 | 0
32 | 0
64 | 0
128 | 0
256 | 13
512 | 12
1024 | 26
2048 |@ 47
4096 | 35
8192 | 0
16384 | 0
32768 | 0
65536 |@@@@@@@@@@@@@@@@@@@@@@@@@@@@@@ 2423
131072 | 0
zfs write /zones/orientdbZone/root/opt/orientdb-community-1.6.4/databases --> 13572 bytes
zfs pwrite /zones/orientdbZone/root/opt/orientdb-community-1.6.4/databases --> 159165824 bytes
numberOf zfs pwrite --> 3230
numberOf zfs write --> 3549
Unfortunately, the write size distribution is almost the same then before for both filesystems.
Test
I conducted many tests, methodically combining different WAL and Datafiles ZFS recordsize.Here you can read a meaningful summary, I hope.
The following table compare the process time (expressed in ms) when there isn’t a WAL dedicated disk, and when we have it.
no wal disk
|
wal zfs recordsize=128k
| |
datafile zfs recordsize=128k
|
183909
|
184860
|
datafile zfs recordsize=64k
|
184766
|
183197
|
datafile zfs recordsize=32k
|
163104
|
183844
|
datafile zfs recordsize=16k
|
162458
|
184245
|
datafile zfs recordsize=8k
|
164102
|
183099
|
datafile zfs recordsize=4k
|
165402
|
183132
|
datafile zfs recordsize=2k
|
168672
|
185219
|
datafile zfs recordsize=1k
|
170987
|
188295
|
datafile zfs recordsize=512B
|
180703
|
193063
|

The following table confirms the hypothesis:
wal zfs recordsize
|
no wal disk
|
128k
|
64k
|
32k
|
16k
|
8k
|
4k
|
2k
|
1k
|
512B
|
datafile zfs recordsize=128k
|
183909
|
184860
|
182213
|
161547
|
161700
|
162424
|
161680
|
161815
|
167806
|
170075
|

If we change the WAL ZFS recordsize we gain the best performance, doesn’t matter what is the datafile ZFS tuning.
This is because of the OrientDB ACID transaction support, then OrientDB uses the WAL for syncronous writes, where the datafiles are updated asyncronously.
When the ZFS compression feature is enabled, in one of the two filesystems or both, it affects the process time only if the recordsize is less then 8k, getting it worse.


Test #4 - OrientDB data files in a dedicated disk, WAL in another zpool with a dedicated ZIL disk
Since all the writes on the WAL partition are synchronous, we can go further if the WAL related zpool has a dedicated disk for ZIL (ZFS Intent Log).Preparation
My test server has only two disks, then I used a 4GB USB flash disk as an additional resource
root@globalZone:~# zoneadm -z orientdbZone shutdown
root@globalZone:~# zpool destroy databases
root@globalZone:~# zfs destroy rpool/wal
root@globalZone:~# zpool create databases c7t1d0 log c10t0d0p0 <-- (USB device)
root@globalZone:~# zfs create -o mountpoint=legacy databases/wal
root@globalZone:~# zfs create -o mountpoint=legacy rpool/datafiles
root@globalZone:~# zonecfg orientdZone
root@globalZone:~# zonecfg -z orientdbZone
zonecfg:orientdbZone> remove fs
zonecfg:orientdbZone> add fs
zonecfg:orientdbZone:fs> set type=zfs
zonecfg:orientdbZone:fs> set special=databases/wal
zonecfg:orientdbZone:fs> set dir=/opt/orientdb-community-1.6.4/wal
zonecfg:orientdbZone:fs> end
zonecfg:orientdbZone> add fs
zonecfg:orientdbZone:fs> set type=zfs
zonecfg:orientdbZone:fs> set special=rpool/datafiles
zonecfg:orientdbZone:fs> set dir=/opt/orientdb-community-1.6.4/databases
zonecfg:orientdbZone:fs> end
zonecfg:orientdbZone> verify
zonecfg:orientdbZone> commit
zonecfg:orientdbZone> exit
root@globalZone:~# zpool status databases
pool: databases
state: ONLINE
scan: none requested
config:
NAME STATE READ WRITE CKSUM
databases ONLINE 0 0 0
c7t1d0 ONLINE 0 0 0
logs
c10t0d0p0 ONLINE 0 0 0
errors: No known data errors
Test
The following table shows the results:
wal zfs recordsize
|
128k
|
64k
|
32k
|
16k
|
8k
|
4k
|
2k
|
1k
|
0,5k
|
import time (ms)
|
162068
|
161338
|
163077
|
161251
|
161384
|
164044
|
164626
|
165946
|
170488
|
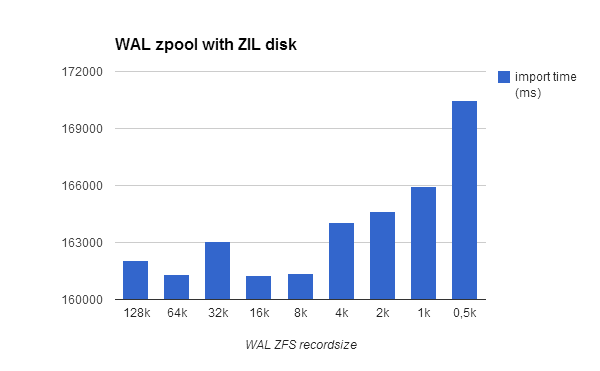
A ZIL disk is related to the zpool like the WAL partition is related to the datafile partition, thus doesn’t matter no more what is the WAL ZFS recordsize, as well as doesn’t matter what is the Datafiles ZFS recordsize if you use a separeted WAL partition.
Interesting to note that the best performance in this context is practically equal to the best performance in other contexts, because I always used the same disks.
If you intend to use a separate ZIL disk, this must be quite faster then the WAL disk, and well optimized for write workloads.
As a proof of concept, I repeated this test using my very slow USB disk as ZIL disk:
root@globalZone:~# zpool status databases
pool: databases
state: ONLINE
scan: none requested
config:
NAME STATE READ WRITE CKSUM
databases ONLINE 0 0 0
c10t0d0p0 ONLINE 0 0 0
logs
c7t1d0 ONLINE 0 0 0
errors: No known data errors
Database import completed in 322240 ms
Doesn’t matter how fast is your WAL disk, if you use a related ZIL disk
Be careful on this. Fast disks can be very expensive, and you need more then only one disk for ZIL, because you need fault tollerance too.
As a final test I verified what happens if I change the ZFS logbias default setting.
From the ZFS man page:
“(logbias) Controls how ZFS optimizes synchronous requests for this dataset. If logbias is set to latency, ZFS uses the pool's separate log devices, if any, to handle the requests at low latency. If logbias is set to throughput, ZFS does not use the pool's separate log devices. Instead, ZFS optimizes synchronous operations for global pool throughput and efficient use of resources. The default value is latency.”
So I re-created the databases zpool without the ZIL disk, then I re-created the ZFS partition:
root@globalZone:~# zfs create -o mountpoint=legacy -o recordsize=32k -o logbias=throughput databases/wal
root@globalZone:~# zfs create -o mountpoint=legacy -o recordsize=32k -o logbias=throughput rpool/datafiles
Database import completed in 203302 ms
Conclusion
- Use the ZFS recordsize=32k (recordsize=16k is good as well);
- Use a separate zpool for the WAL;
- Use the ZFS compression=on for the datafiles partition: the process time remains the same but you can save precious disk space;
- Consider adding a ZIL disk for the WAL zpool, but only if you are expericing a serious performance falling. May you can save money adding another instance in a ditributed topology.
NOTE 2014/06/30:
For an (almost) real use case, read here, especially about ZFS recordsize considerations!
For an (almost) real use case, read here, especially about ZFS recordsize considerations!
No comments:
Post a Comment